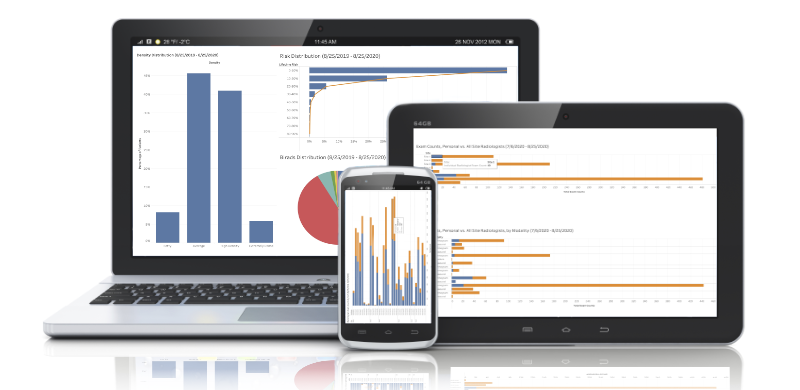
Ikonopedia “Insight” is a colorful, interactive data visualization tool that provides valuable insight into your patient data
Ikonopedia “Insight” helps breast imaging facilities utilize data to provide better care and improve practice efficiency. “Insight” uses customers’ patient intake information, imaging data and clinical risk assessments to provide end-to-end visualization of patient care, from screening to treatment and follow up.
This interactive visualization tool lets you dive deep to answer questions you never thought possible. Unlike other breast reporting systems, Ikonopedia stores all data including exam findings as discrete data that can be brought to life in our new “Insight” module.
Data is displayed in interactive dashboards with colorful charts and graphs. If you want to know more about the data behind a particular bar-graph or pie-chart, you can click on those items to open new visualization elements — giving you actionable understanding of your patient data.
As radiologists face increasing exam volume and data complexity, Ikonopedia Analytics provides easy access to high level clinical and administrative data and trends, such as exam counts over a period of time, rates of malignancy in certain patient types, exam reading times for physicians, mobile site productivity and more. Ikonopedia Analytics uses data already entered into the system to generate a variety of BI-RADS® compliant static reports that are available for both internal evaluation and external audits, such as MQSA compliance audits.
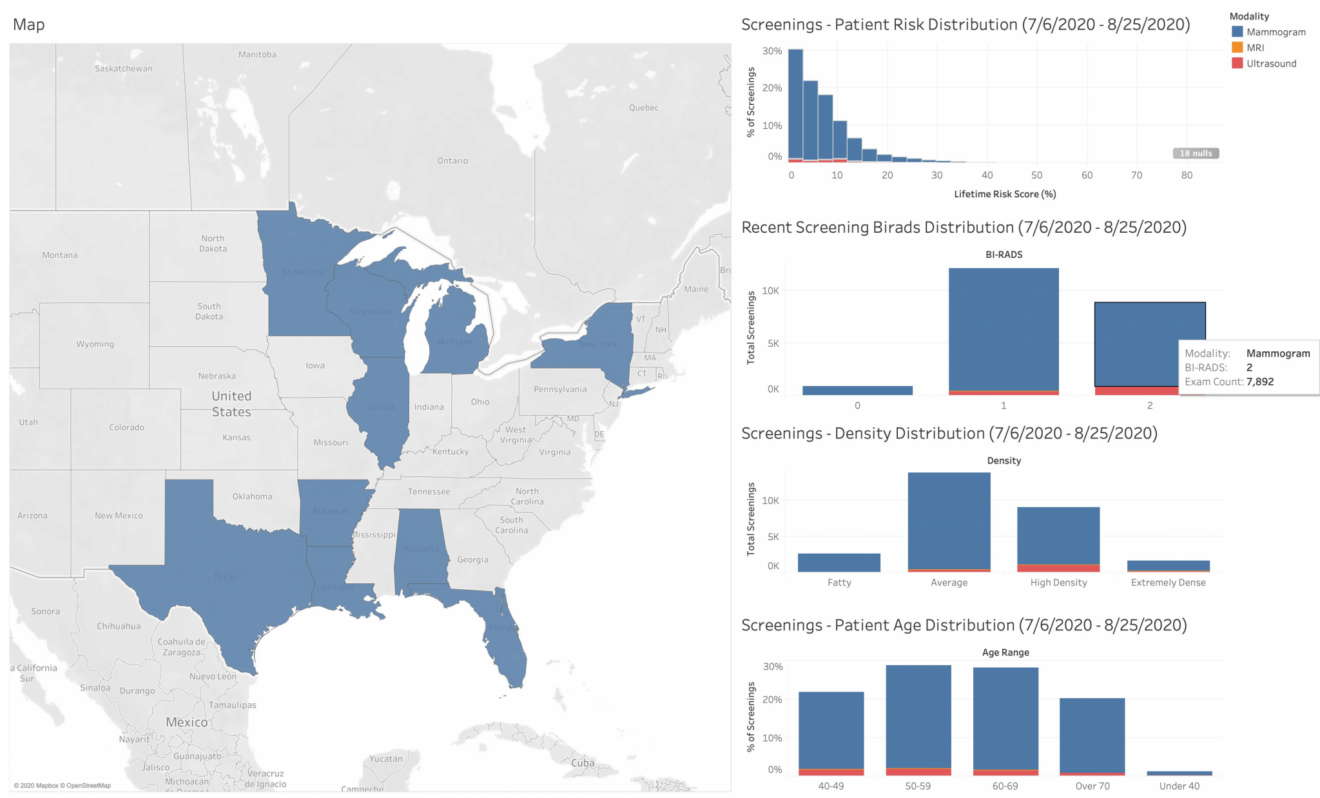
“Insight” leverages Ikonopedia’s structured reporting modalities to enable customers to learn more about patient demographics (identify those who may need more frequent screenings for follow up to improve quality of care, etc.), identify organizational operational trends (where staffing adjustments may be needed to address patient volume load), identify personnel and potential training gaps (who is under performing/over performing within the department). Examples of clinical and administrative dashboards include:
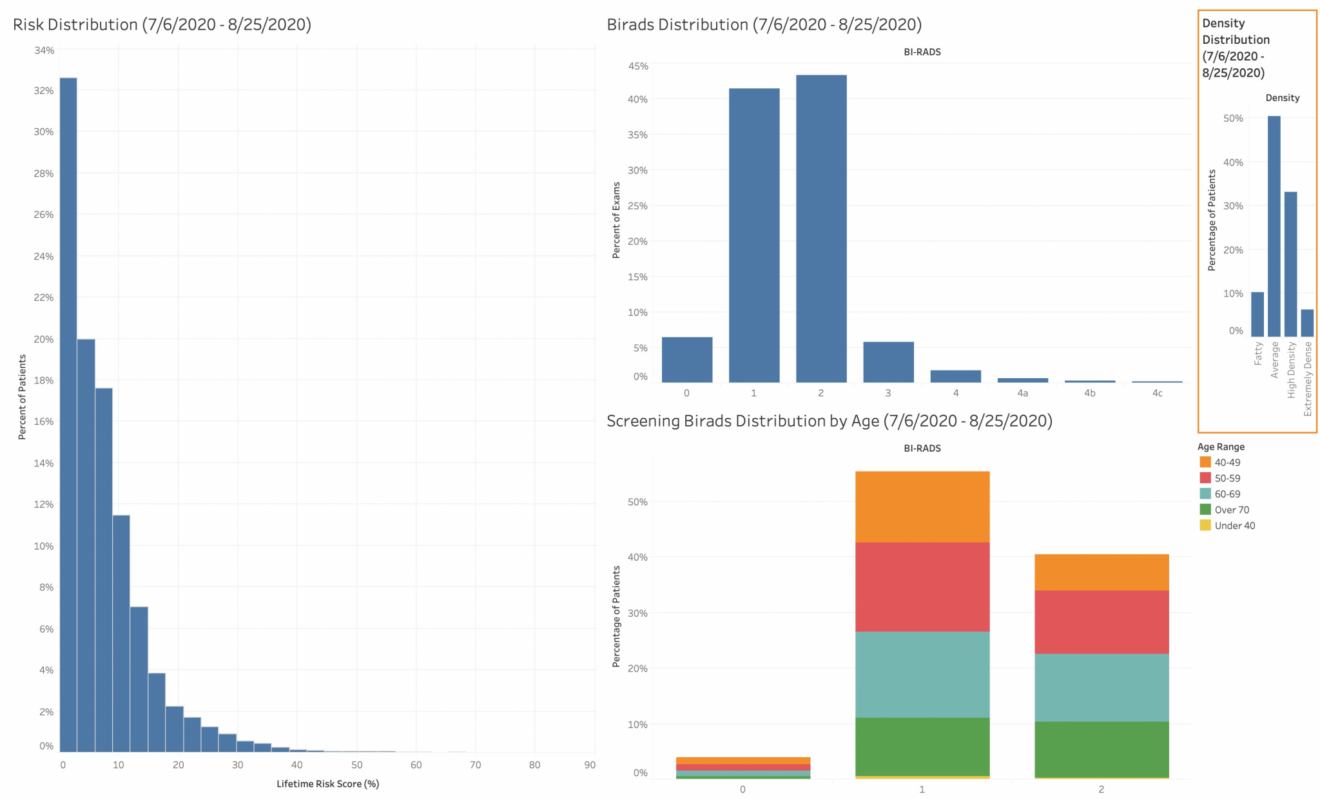
- Screening population risk distribution by age, by breast density, by ethnicity, by BI-RADS® results;
- Breast density population distribution by age; by risk; by BI-RADS® results;
- Time for Interval cancers between negative results and diagnosis;
- Time to resolution for BI-RADS®-0 exams;
- Screening compliance by referring physician;
- Breast MR exam volume compared to practice’s high risk patient population.
“The adoption of risk-based screening based on a woman’s personal risk factors is critical to take breast cancer screening to the next level, improving both patient outcomes and quality of life,” said László Tabár, MD, and co-founder of Ikonopedia. “In order to make that possible, radiologists must be able to easily visualize patient specific risk and density data to make informed decisions about modality combinations, surveillance intervals and when to initiate regular screening. This new analytics module provides these capabilities in an intuitive format that can be customized and tracked over time.”
Ikonopedia is an innovative structured breast reporting and MQSA management system designed to dramatically improve reporting efficiency, and optimize facility operations. All findings are saved as discrete data which allows Ikonopedia to prevent errors, maintain BI-RADS-compliant language and automate many time-consuming processes. Ikonopedia makes it possible to eliminate laterality errors, automatically choose exam-appropriate patient letters and pull forward findings from past exams along with many other time-saving features.
Ikonopedia’s integrated risk assessment tool is now available in dozens of languages and risk data is used to create alerts for the radiologist, populate the clinical section of the report, and automatically update the patient letter. A high-risk patient alert identifies patients with a 20% or greater lifetime risk and information about the score is instantly viewable.
About Ikonopedia
Ikonopedia was founded by three expert breast imaging Radiologists: László Tabár, MD is the author of 6 books in 10 languages on mammography and a world renowned educator; A. Thomas Stavros, MD is the author of one of the most popular reference books in the field of breast ultrasound; and Michael J. Vendrell, MD is an expert in breast MRI and CAD design with extensive experience in breast-imaging software. For more information, visit www.ikonopedia.com.
# # #
Media Contacts:
Emily Crane
Ikonopedia
801.673.4272
emily.crane@ikonopedia.com
Social Media