What if you could utilize your organization’s patient and exam data to provide better care and improve productivity? The Ikonopedia Analytics module makes it possible.
The module uses data already entered into the system (patient information, imaging exams, follow-up, etc) to generate a variety of BI-RADS® compliant static reports that give a high-level summary of key information.

Reports are available for both internal evaluation and external audits, such as MQSA compliance audits. Analytics makes it not only possible but straightforward and simple to determine exam counts over a period of time, rates of malignancy in certain patients, and a variety of other counts and trends.
Additionally, taking the idea of making data work for customers is now about to go a step further. Coming up on the horizon is a new and exciting addition to Ikonopedia’s analytics abilities – Ikonopedia Insight.
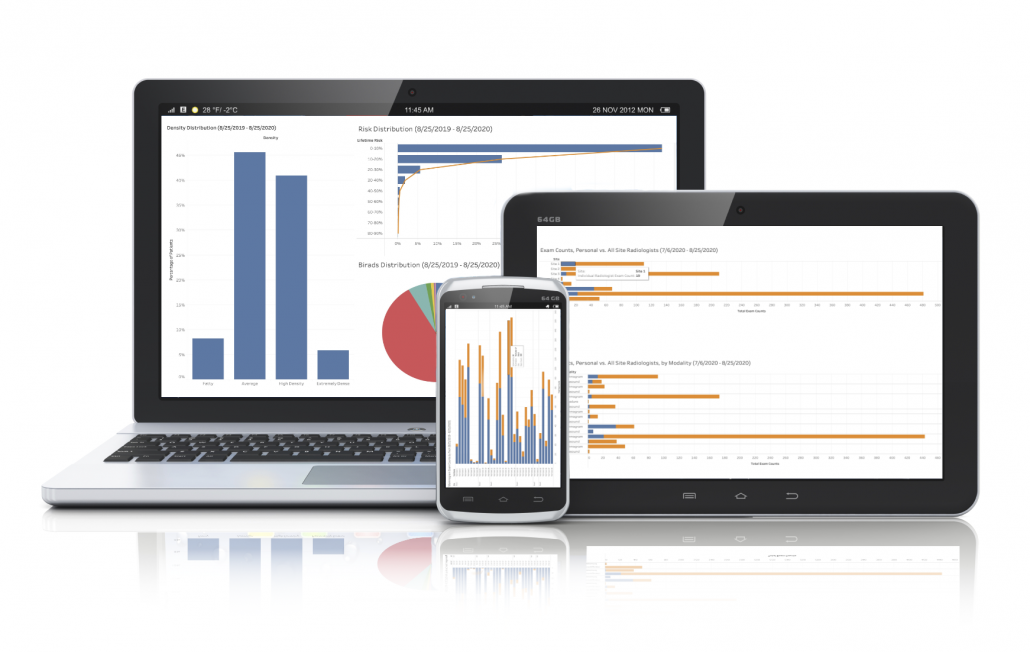
Insight will allow customers to dive even deeper into their existing patient and exam data than even the current Analytics report suite.

Through interactive, colorful, and frequently-updated visualizations, customers will be able to learn more about patient demographics (dial in to who may need more frequent screenings for follow up to improve quality of care, etc.), identify organizational operational trends (where staffing adjustments may be needed to address patient volume load), identify personnel and potential training gaps (who is under performing/over performing within the department) and so much more.
We are living in a world where access to specific data in a timely fashion is king. Whether it is normal business related tasks, deep dives for research or navigating the unusual and urgent needs of a pandemic, accessing detailed information in today’s environment with today’s technology should not be difficult. At Ikonopedia, we are constantly striving to have the software do the heavy lifting to make you and your staff as efficient as possible in whatever task you are engaged in.
Social Media